
Total Thickness: 1000 mbar – 500 mbar
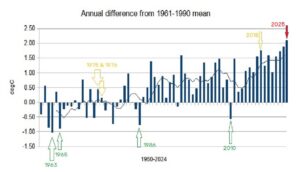
> The chart displayed here, covering the years 1960 until 2024 (latest available as at this update), portrays the mean temperature of the portion of the atmosphere between the ‘surface’ and approximately 18000ft / 5.5 km.
On the graph, each year’s difference in temperature (degC) from the base mean is shown. The thin variable line is the 5-year running mean value.
Additional notes:
> Thickness is derived by finding the difference in altitudes between the 1000 millibar and 500 millibar surfaces of constant atmospheric pressure – these being often used in practical meteorology to determine not only distribution of temperature, but in the case of the 500 mbar level, development of ‘weather’ features that affect all of us.
> As well as being a useful measure of temperature away from the influence of surface-based variables it has uses that summarise other factors in a changing atmosphere – e.g., warmer air in this zone can support more moisture in all its phases, and therefore carries useful information regarding the changing heat & moisture distribution represented.
> This series is centred on a spot in the Midlands (roughly near Birmingham) which point is chosen as it can be tied to variations in the longest series of temperature records anywhere in the world – the Central England Temperature series, that begins in 1659. The base chosen (1961-1990) is the ‘standard’ used in many climatological studies.
> Four notably cold years are indicated (1963, 1965, 1986, 2010) mainly to show how dramatic is the change from the early part of the series: very few significantly cold years in this series since the latter 1980s. Conversely, the warm years have been gaining ground considerably since that time – the one year of 2010 stands out as the outlier within a short few years of hesitation in the relentless upward curve. The eagle-eyed might be surprised at the 1976 plot: although that summer was stunning, if was followed by a four-month run (September – December) of well-below average temperatures, which extended into January of 1977.